Difference between revisions of "Induction Motor Model"
(Created page with "== Single Cage Model == right|thumb|350px|Figure 1. Single cage model equivalent circuit The single cage model has the following para...") |
|||
| (One intermediate revision by the same user not shown) | |||
| Line 85: | Line 85: | ||
== Related Topics == | == Related Topics == | ||
| + | :* [[Induction Motor Torque]] | ||
| + | :* [[Induction Motor Performance]] | ||
:* [[Motor Parameter Estimation from Steady-State Models]] | :* [[Motor Parameter Estimation from Steady-State Models]] | ||
[[Category:Modelling / Analysis]] | [[Category:Modelling / Analysis]] | ||
Latest revision as of 08:07, 22 November 2020
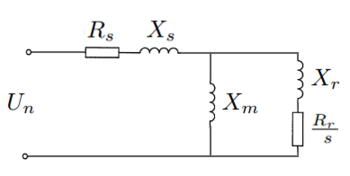
Single Cage Model
The single cage model has the following parameters:
- = motor terminal voltage
- = stator resistance
- = stator leakage reactance
- = magnetising reactance
- = rotor resistance
- = rotor reactance
It has been shown (for example, in [1]) that the single cage model is not able to capture both the starting characteristics and the breakdown torque characteristics of a cage induction motor. Therefore for motor startup simulations, the double cage model is recommended.
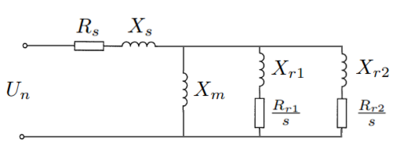
Double Cage Model
The double cage model has the following parameters:
- = motor terminal voltage
- = stator resistance
- = stator leakage reactance
- = magnetising reactance
- = inner cage rotor resistance
- = inner cage rotor reactance
- = outer cage rotor resistance
- = outer cage rotor reactance
Core Losses
You will notice that in the models above, the shunt magnetising branch is represented as a magnetising reactance only (). In a practical motor, there will also be eddy currents in the core laminations that manifest themselves as heat losses. These so called core (or iron) losses can be modelled as a shunt resistance as per the standard transformer model.
Parameter Mismatch with Measured Data
Manufacturers sometimes provide the electrical parameters for the motor equivalent circuit (usually the single cage model) on their data sheets, based on measured test data (e.g. using the standard tests in IEEE Std 112). However, if one were to compute the motor torque-speed curve using these parameters, significant differences will often be found between the torque-speed curve implied by the equivalent circuit and the torque-speed curve from the manufacturer’s performance data (e.g. breakdown torque, locked rotor torque, etc) [2].
The reason for this is that the equivalent circuit model is a simplification of reality. For modelling purposes, we would like an equivalent circuit with constant parameters that is reasonably accurate (when compared to the performance data) over the full range of slip values. However, this simplified model doesn't take into consideration a number of factors present in practical motors, for example:
- The equivalent circuit parameters are not constant, and actually vary with frequency (slip). The manufacturer will sometimes provide measured electrical parameter data at various slip values and they will no doubt be different. For example, rotor resistance is frequency (slip) dependent, caused by eddy currents in deep and shaped rotor bars. Likewise, leakage inductances vary due to eddy currents and saturation of the leakage flux path [3]
- The parameters also vary with temperature and saturation of the teeth and core [4]
- Stator resistance is normally measured with a dc resistance test (e.g. IEEE Std 112), but the ac resistance may be different in practice and is also temperature dependent
- Saturation of the leakage path of stator and rotor magnetic fields during DOL starting reduces the leakage reactances at locked rotor conditions. However the locked-rotor test is done at reduced voltages to simulate full load currents. Therefore the test doesn’t actually simulate the high currents on starting and thus tends to overestimate the rotor and stator leakage reactances.
- The skin effect reduces rotor leakage inductance
- The effect of space and time mmf harmonics
- For deep bar or double cage machines, classical no-load and locked rotor tests result in rotor resistances that are often too high
As mentioned above, we want an equivalent circuit with constant parameters that is reasonably accurate over the full range of slip values from 0 to 1pu. Sometimes such an equivalent circuit doesn’t actually exist, and in such cases we have to decide which parts to sacrifice (e.g. if only the starting characteristics are important in the study, then it may be acceptable for the full-load characteristics to be less accurate).
Parameter Estimation
The equivalent circuit parameters of an induction motor can be estimated by various classes of parameter estimation methods, depending on what type of data sets are available and the applications of the model. The estimation methods generally fall into one of five classes [5]:
| Class | Description | Data Required | Applications |
|---|---|---|---|
| 1. Parameter calculation from motor construction data | Accurate electromagnetic field based calculation of motor parameters | Details on motor construction, e.g. geometrical and material data | Design and manufacture of induction motors to meet certain performance requirements |
| 2. Parameter estimation based on steady-state motor models | Iterative estimation algorithms based on steady-state network data and motor manufacturer data | Motor performance data from manufacturer, e.g. nameplate details, torque-slip curves, current-slip curves | Desktop (offline) power system studies |
| 3. Frequency-domain parameter estimation | Parameter estimation based on stand-still frequency response (SSFR) test measurements and resulting transfer function | SSFR test results | Offline power system studies when SSFR test results are available (more accurate than estimation based on steady-state models) |
| 4. Time-domain parameter estimation | Time-domain motor test measurements are used to tune model parameters | Motor test and measurement setup | Simplified models based on real test data |
| 5. Real-time parameter estimation | Simplified model sstimation based on real-time measurements of actual motor operation | Motor sensors and measurement devices | Online tuning of induction motor drive controllers (e.g. variable speed drives) |
References
- [1] Pedra, J., “Estimation of typical squirrel-cage induction motor parameters for dynamic performance simulation”, IEEE Proceedings on Generation, Transmission and Distribution, Vol. 153, No. 2, 2006
- [2] Filho, E., Lima, A., and Jacobina, C., “Parameter Estimation for Induction Machines via Non-Linear Least Squares Method”, Conference proceedings of IECON, 1991
- [3] Rogers, G., Shirmohammadi, D., “Induction Machine Modelling for Electromagnetic Transient Program”, IEEE Transactions on Energy Conversion, Vol. EC-2, No. 4, 1987
- [4] Waters, S. S., Willoughby, R. D., "Modeling Induction Motors for System Studies", IEEE Transactions on Industry Applications, Vol 1A-19, No. 5, 1983
- [5] Lindenmeyer, D., Dommel, H. W., Moshref, A., and Kundur, P., "An induction motor parameter estimation method", Electrical Power and Energy Systems, Vol. 23, 2001


